How is this related?
In this post, we'll take a look at how we can find out in what way data is...


At certain times you might be faced with unexpected patterns or events appearing in your data. Let's take a look on how we can tackle anomalies, by detecting them.
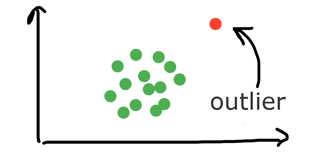
Imagine you're exploring a data set and suddenly notice some anomalies.
As an example we'll take a look at unexpected locations of player kills in a videogame. Every record has a certain map, x and y attached to it.
Going by the data there are two maps, so first things first we'll need to filter the data on only including one of them:
df = pd.read_csv(filePath, usecols=['map','victim_position_x','victim_position_y'], nrows=20000) # first 20K rows
df = df.loc[(df['map']=='ERANGEL')] # select one of the maps
If we then plot this data we get a good looking cluster of points:
deaths = df[['victim_position_x','victim_position_y']].as_matrix(columns=None)
plt.scatter(deaths[:,0],deaths[:,1])
plt.show()
plt.clf()

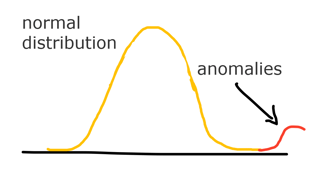
Immediately we can spot quite a few outliers in our data, but how do we predict which are anomalies and which aren't? To do this we can use gaussian (also named normal) distribution to help with anomaly detection.
Gaussian distribution is a function which predicts the exact distribution of events and with it, can be used to determine extreme values which fall outside of the general pool of observations using the mean and variance.
mu = deaths.mean(axis=0)
sigma = deaths.var(axis=0)
[5.71298987 5.35145847] [7.36143001 6.82879176]
We determine a probability treshold which can indicate an outlier and the probability that a death falls into the normal distribution (see the notebook for the select_treshold function).
epsilon, f1 = select_threshold(pval, yval)
outliers = np.where(p < epsilon) # get outliers
We can then apply these probabilities to indicate which deaths are normal and which are anomalies. Plotting this data we can easily show the normal distribution as blue and the outliers as red dots:
# plot data
plt.scatter(deaths[:,0], deaths[:,1])
 # plot outliers
plt.scatter(deaths[outliers[0],0], deaths[outliers[0],1], s=50, color='r', marker='o')
plt.show()

Of course this is only one way of doing anomaly detection, in the future we may look at other techniques to tackle this problem.
Get the code here!


In this post, we'll take a look at how we can find out in what way data is...

Suppose you want to predict what the length or width of a flower petal.For this...

Blog comments