Pipeline Log
Apache Hop is a data engineering and data orchestration platform that allows data...


Apache Hop is a data engineering and data orchestration platform that allows data engineers and data developers to visually design workflows and data pipelines to build powerful solutions.
After your project has gone through the initial development and testing, knowing what is going on in runtime becomes important.
The Workflow Logs in Hop allow workflow logging information to be passed down to a pipeline for processing as JSON objects. The receiving pipeline can process this logging information with all the functionality Hop pipelines have to offer, e.g. write to a relational or NoSQL database, a Kafka topic, etc.
Hop will send the logging information for each workflow you run to the Workflow Log pipeline you specify.
In this post, we'll look at an example of how to configure and use the Workflow Log metadata to write workflow logging information to a relational database.
To create a Workflow Log click on the New -> Workflow Log option or click on the Metadata -> Workflow Log option.
The system displays the New Workflow Log view with the following fields to be configured.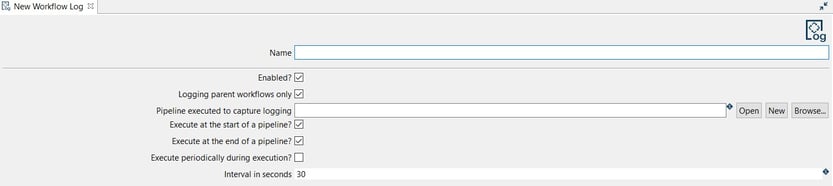
The Workflow Log can be configured as in the following example:
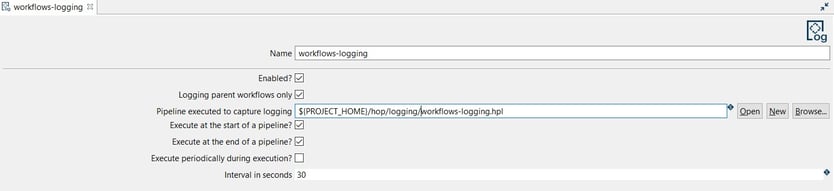
TIP: You should select or create the pipeline to be used for logging the activity. In this case, the Workflow Logging transform is used but let’s do it as the second step.
Finally, save the workflow log configuration.
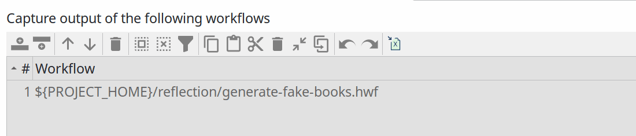
PRO TIP: workflow logging will apply to any workflow you run in the current project. That may not be necessary or even not desired. If you want to only work with logging information for a selected number of workflows, you can add a selection of workflows to the table below the configuration options ("Capture output of the following workflows"). The screenshot below shows the single "generate-fake-books.hwf" workflow that logging will be captured for in the default Apache Hop samples project.
To create the pipeline you can go to the perspective area or by clicking on the New button in the New Workflow Log dialog. Then, choose a folder and a name for the pipeline.
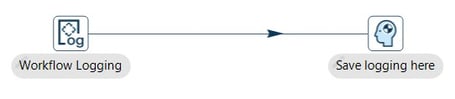
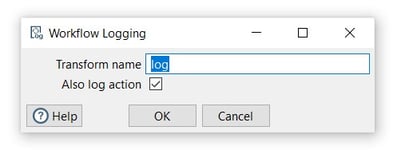
A new pipeline is automatically created with a Workflow Logging transform connected to a Dummy transform (Save logging here).
Now it’s time to configure the Workflow Logging transform. This configuration is very simple, open the transform and set your values as in the following example:

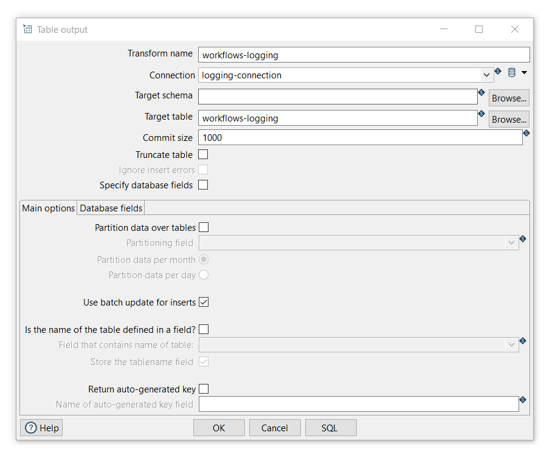
The Table Output transform allows you to load data into a database table. Table Output is equivalent to the DML operator INSERT. This transform provides configuration options for the target table and a lot of housekeeping and/or performance-related options such as Commit Size and Use batch update for inserts.
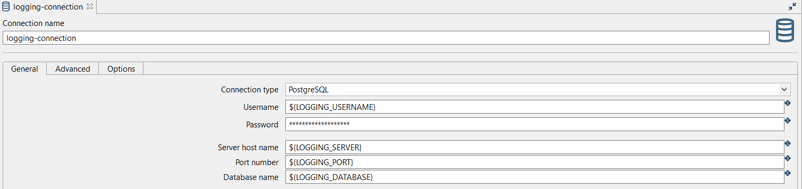
TIP: In this example, we are going to use a relational database connection to log but you can also use output files. In case you decide to use a database connection, check the installation and availability as a pre-requirement.
Add a Table Output transform by clicking anywhere in the pipeline canvas, then Search 'table output' -> Table Output.

Now it’s time to configure the Table Output transform. Open the transform and set your values as in the following example:
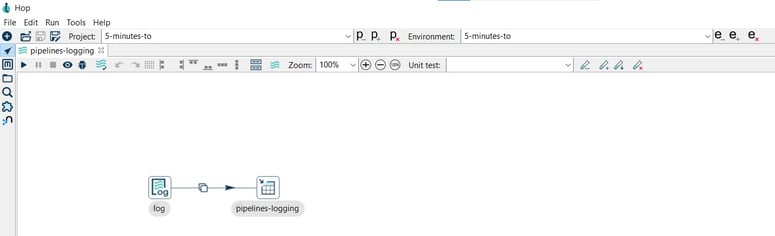
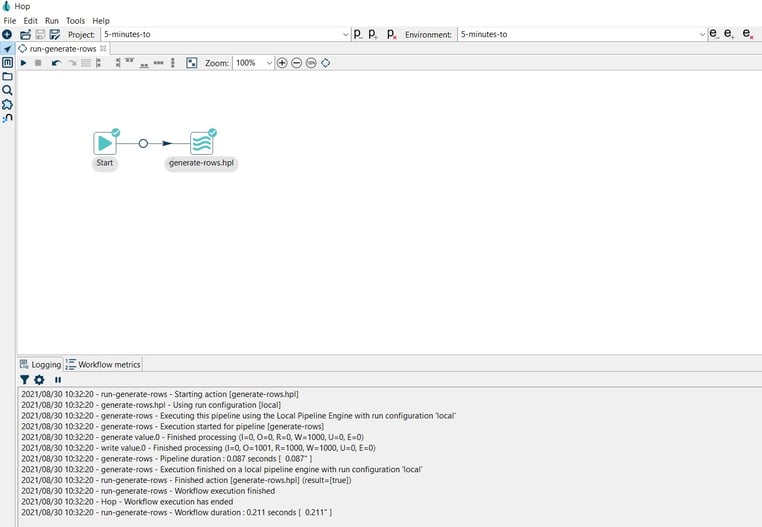
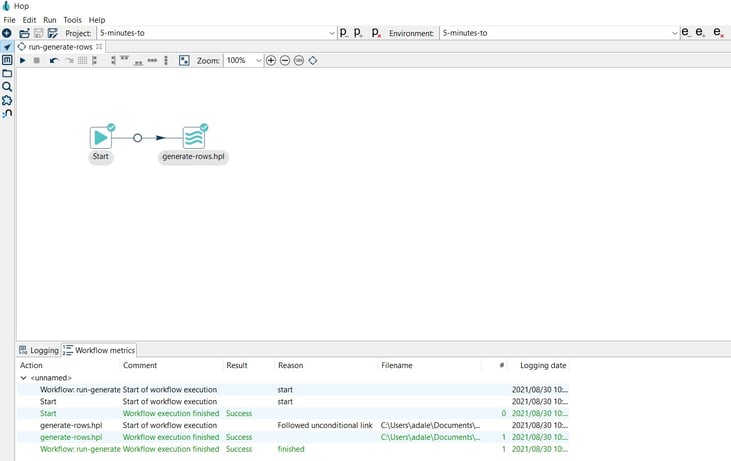
Finally, run a workflow by clicking on the Run -> Launch option. The Workflow Log pipeline will be executed by any workflow you'll run.
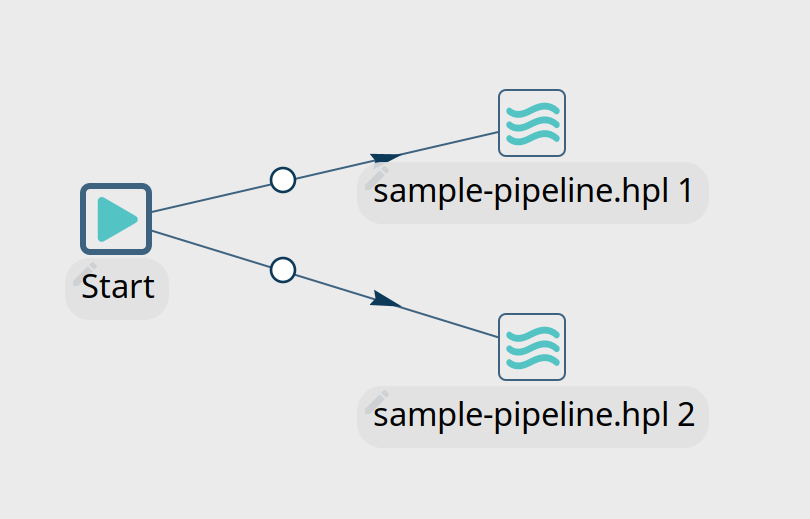
In this case, we use a basic workflow that executes a pipeline, both are included in the 5-minutes repository.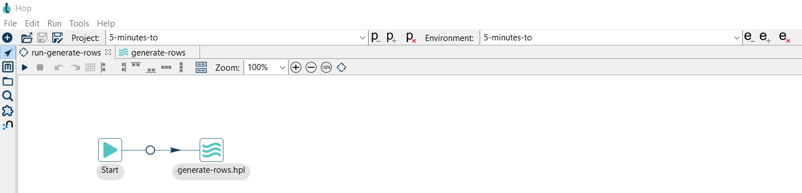
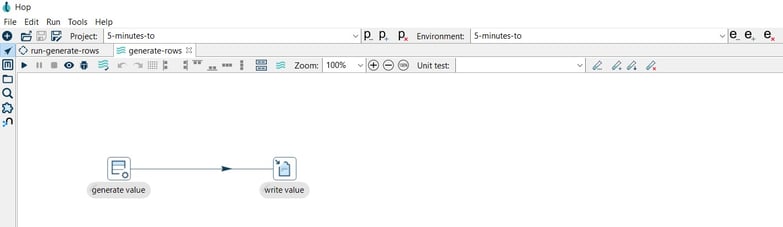
The executed pipeline (generate-rows.hpl) generates a constant and writes the 1000 rows to a CSV file:
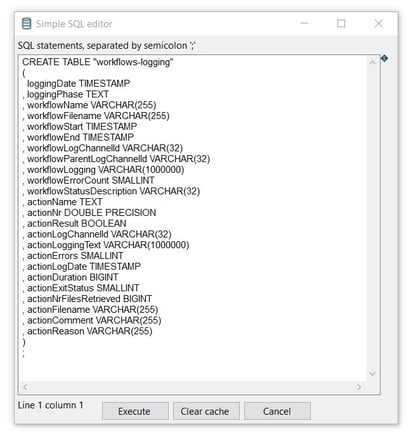
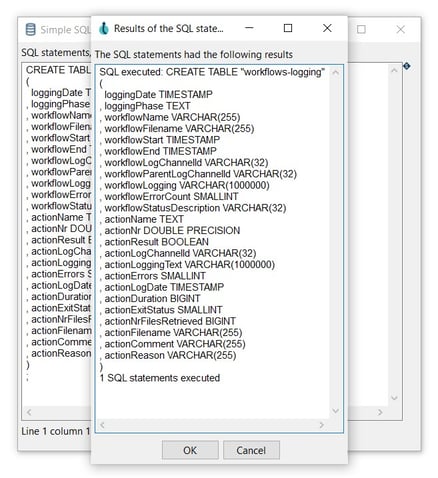
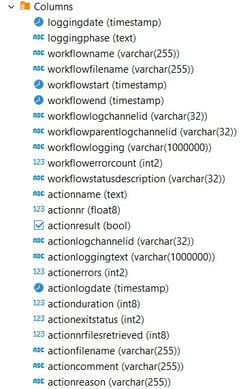
The data of the workflow execution will be recorded in the workflows-logging table.
Check the data in the table.

You now know how to use the workflow log metadata type to work with everything Apache Hop has to offer to process your workflow logging information.
Feel free to reach out if you'd like to find out more or to discuss how we can help with pipeline logging or any other aspect of your data engineering projects with Apache Hop.
You can find the samples in 5-minutes-to github repository. As always, this post will be contributed back to the Apache Hop docs.
Want to find out more? Download our free Hop fact sheet now!

Apache Hop is a data engineering and data orchestration platform that allows data...
In any data engineering project, there are lots of use cases where you'll want the same process to...
One of the first concepts new Apache Hop users learn is that pipelines are executed in parallel and...
Blog comments