What's weird about this?
At certain times you might be faced with unexpected patterns or events...

In this post, we'll take a look at how we can find out in what way data is structured or related.
Clustering or cluster analysis is a way of getting an idea about how data is structured or related.
For instance, when dealing with geographical data such as sightings of unidentified flying objects (UFOs) it may be interesting to see whether these sightings are clustered around certain points or how there are related.
The dataset we'll use in this post is a collection of UFO sightings from the last century. We'll use the latitude and longitude to see if the sightings are clustered around certain points.
 df = df.dropna(how='any') # remove null
 geo = df[['long','lat']].as_matrix(columns=None) # as matrix
 plt.scatter(geo[:, 0], geo[:, 1]); # scatter plot
 plt.show() # show plot
 plt.clf() # clear plot
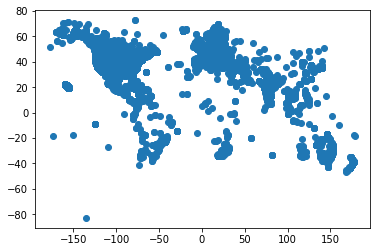
But how does this fit together?
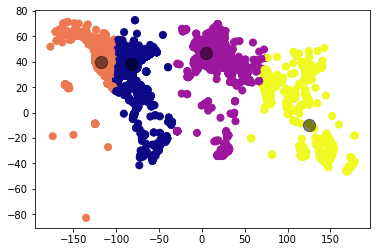
A simple way of doing this is using K-Means clustering. With K-Means we decide on a number of centers around which our data is grouped.

A downside to this method is that we have to manually decide on a valid number of clusters to run. Since we plotted the data above we can simply derive a quantity by looking at how our data is spread.
 kmeans = KMeans(n_clusters=4) # 4 clusters
 kmeans.fit(geo) # fit geo matrix
 y_kmeans = kmeans.predict(geo) # predict kmeans

 plt.scatter(geo[:, 0], geo[:, 1], c=y_kmeans, s=50, cmap='plasma')
 centers = kmeans.cluster_centers_ # cluster centers
 plt.scatter(centers[:, 0], centers[:, 1], c='black', s=150, alpha=0.5); # scatter plot
 plt.show() # show plot
 plt.clf() # clear plot
 é
é


At certain times you might be faced with unexpected patterns or events...

Suppose you want to predict what the length or width of a flower petal.For this...

As a follow-up to last week's machine learning tidbit let's look at an example of...
Blog comments