What is a graph database?
Although graph theory has been around for centuries, graph databases...


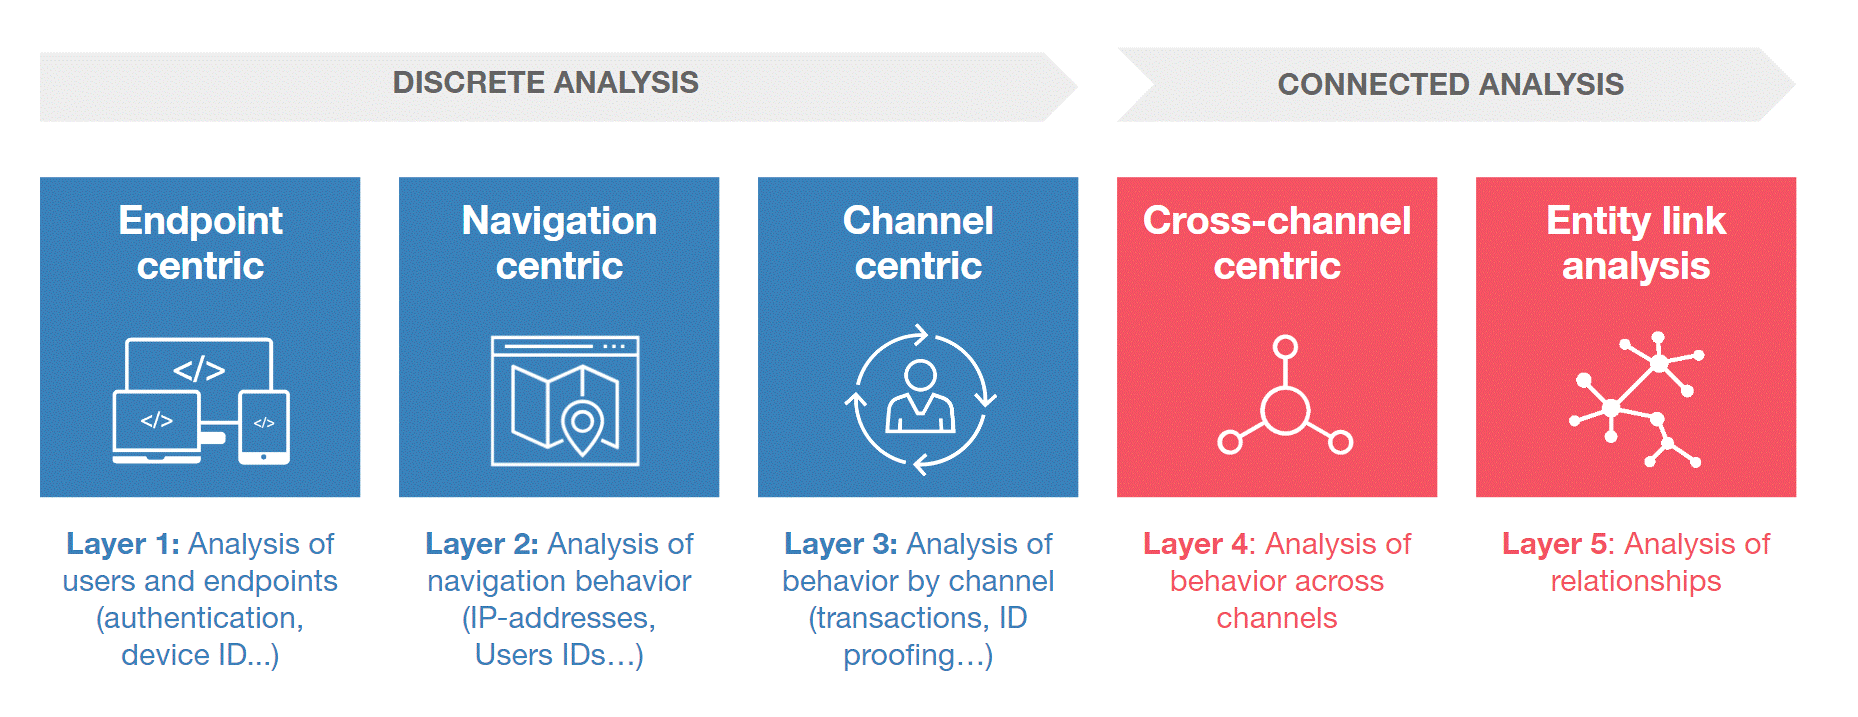
Figure 1: Gartner layered model for fraud detection
Fraud is an understanding that has been around for a vast amount of time. Fraudsters are pretty much always one step ahead which means detecting fraudulent behavior is like finding a needle in a haystack.
When storing data in a typical relational database finding anomalies in your data can be difficult and can cost quite a bit on resources and time. Graph databases like Neo4j are designed to traverse relationships and find anomalies with little to no effort. (If you want to learn more about graph databases, read our blogpost on graph use cases: 'Graph Databases - Analytical Use Cases')
Fraudulent behavior can be found in a number of business fields such as Finance, eCommerce, Insurance, etc. To help catch the bad guys, we will explain two ‘types’ of fraud detection with graph databases.
In the common day-to-day life, a person establishes a certain routine: wake up, go to work, have some family time, etc. This ‘routine’ allows businesses such as banks or eCommerce to create relationships with clients by storing IP addresses, tracking cookies, commonly used device(s) or even their geographical location. They create a pattern based on the history of purchases or transactions. Looking at a “normal” pattern means anomalies show up much faster and with less effort.
You are probably wondering how graphs come in to play with fraud detection, so here’s how: graph databases like Neo4J work with a declarative language. Companies can declare a pattern of what is considered to be normal behavior and search for actions that don’t match that pattern.
Let’s say Fred buys a new book online every week, he orders it on his iPhone from his home in London.

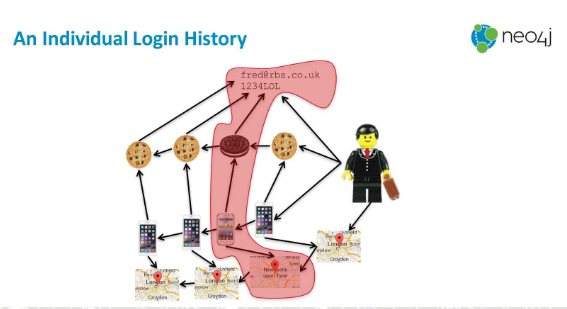
Figure 2: An individual login history ~ Dr. Jim Webber - Graphs vs. Fraud
By looking at Fred’s purchase history, the online company sees that Fred has ordered something but from a different phone in a different city. They flag this as ‘suspicious’ or ‘fraudulent' behavior. By traversing the graph and searching for relationships that don’t match the pattern, finding anomalies is a quick and easy process.
Fraudsters have become increasingly more deviant and no longer operate on a solo-basis but form groups to carry out their evil plans. A fraud ring is one of those schemes to trick banks or insurance companies out of tons of money. Two fraudsters can rack up to $1.5M.
Using their home address and phone number, fraudsters create persona’s that are used to get access to credit cards or unsecured loans. By the time they get the most out of these credits, the personas disappear, resulting in a financial loss for the banks.
Another common example is insurance fraud where fraudsters create a web of drivers, passengers, witnesses, lawyers and doctors to cause accidents and collect insurance money.
Finding fraud rings with graphs means searching for shared information between personas that are unusual to say the least. Finding the ring in the first example is finding multiple people on the same address but with a different phone number or different people with the same social security number, etc. (Social security numbers are unique to a person, so a duplicate value is impossible).
The same applies to the insurance example, people involved in multiple accidents or witness more than a few accidents in a matter of months is often not the result of bad luck. In Great Britain, 185K car drivers where involved in a car accident in 2016. Considering there were 65,64M people living in Great Britain at that time, the chance of a person being in a car accident is about 0,30% .[1] So, having more than one accident in a few months means you are either a terrible driver (and you should probably stay off the road), you have some serious bad luck (in which case again stay off the road please) or you are part of an intricate web of insurance fraudsters.
Traversing relationships is the key concept of graph databases, which allows us to search for patterns or weird links with a fraction of the cost of relational databases.
Another cool feature of graphs is triadic closures. These create trusted relationships between persons based on existing relationships with a shared acquaintance. Through these transitive relationships[2], it’s possible to identify networks of fraudsters and targets.
Triadic closure is often used in social media to suggest a relationship based on a friend-of-a-friend relationship. Let's say Fred knows Jinger and Jinger is friends with Ella. Because Fred and Ella both know Jinger, a relationship between them is suggested.
When applying this theory to fraud detection the goal is to create an 'anti-recommendation'. For example: Jinger is friends with Ella, Fred is a fraudster who has tricked Jinger into given him personal data. With this knowledge triadic closure can be used to warn Ella not to trust Fred.
[1] https://www.statista.com/statistics/322906/car-drivers-involved-in-road-accidents-in-great-britain-uk/
[2] Wikipedia.com: “A binary relation R over a set X is transitive if whenever an element a is related to an element b and b is related to an element c then a is also related to c. Transitivity (or transitiveness) is a key property of both partial order relations and equivalence relations.”

Although graph theory has been around for centuries, graph databases...
Wikipedia's describes data lineage as:

Neo4j is the world's leading graph database management system, designed for optimized fast...

Blog comments